

Going Around for Mac
A briefing, charts, and maps on your desktop.
Download for Mac ↓ Going AroundiPhone beta ↗
The science is complex. Getting a sense of what’s going around shouldn’t be. Meet your local illness briefing, for Mac and iPhone.
Public data. Plain language. Your community.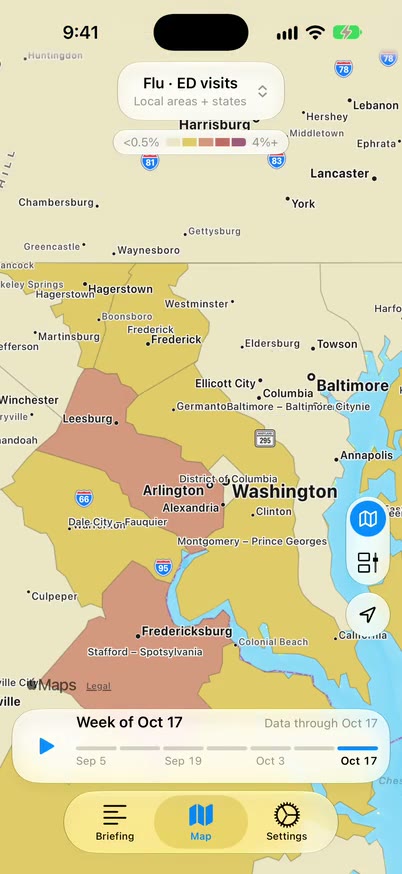
Follow COVID-19, flu and RSV, plus other respiratory viruses, stomach bugs and reportable diseases like measles, wherever public data exist.
Each illness is measured several ways: virus levels in wastewater, emergency department visits, hospital admissions, lab test positivity and reported cases. Going Around puts them together, with the date and source behind every reading.
What changed in your area, in plain language.
Charts, reporting dates, and links to public sources.
Zoom from the whole country down to local reporting areas, or play through past weeks.
Different surveillance measures tell different parts of the story. Going Around keeps sources and reporting dates close to each reading, so you can understand what the data show.
Made for your Mac. Ready to go on your iPhone.
Mac: macOS 15 or later, free, updates itself. iPhone: public beta through TestFlight.
A briefing, charts, and maps on your desktop.
Download for Mac ↓Your local picture, wherever the day takes you.
Join the TestFlight beta ↗